Pig Health Assessment Based on Applied Sensors – Smart Pig Health
Leveraging digitised sensors and prediction models to predict diseases among pigs early on and providing transparent information to all stakeholders.
Concept
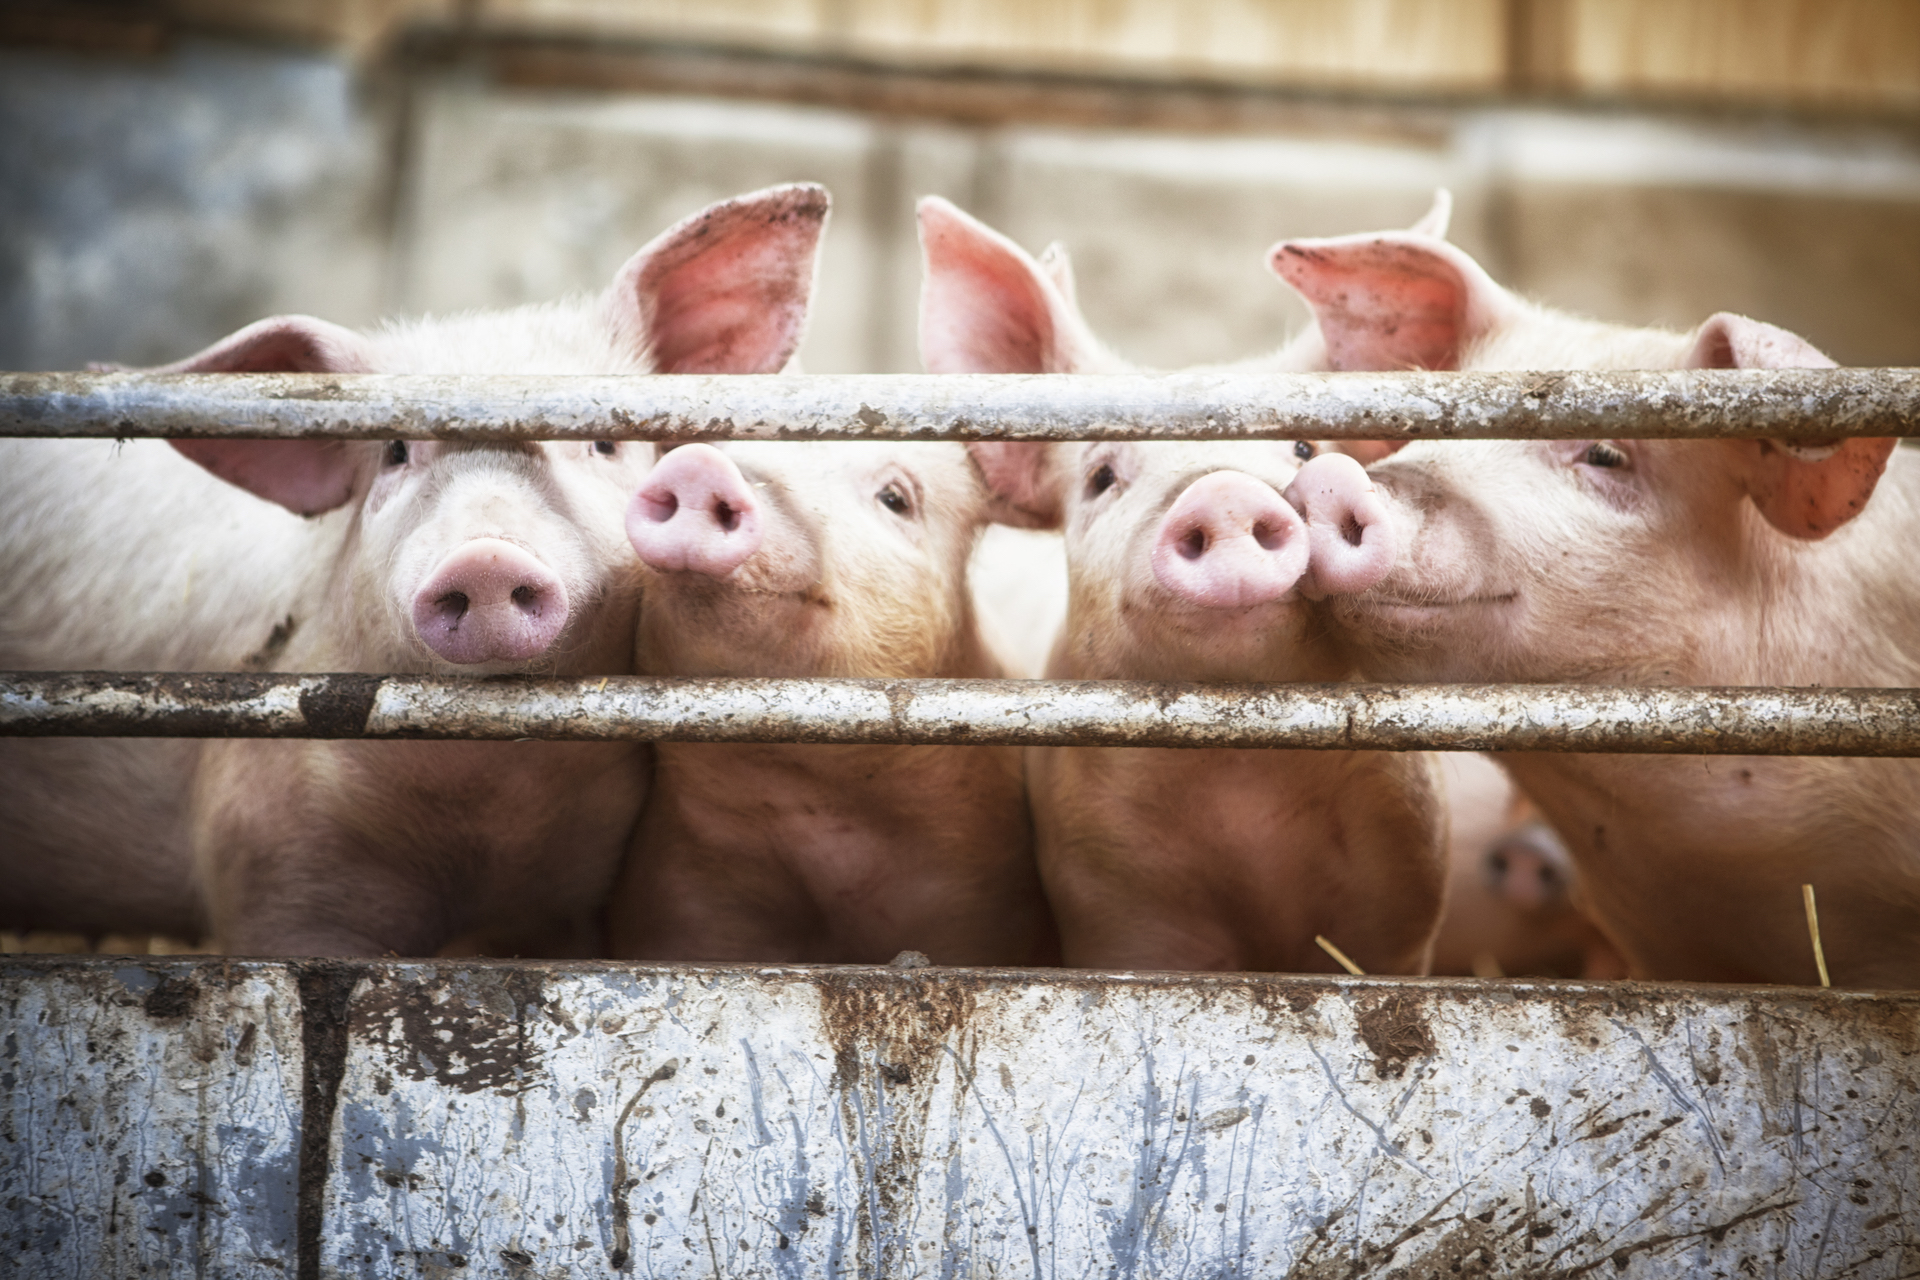
Pig health and animal welfare are inextricably linked with the use of antibiotics and are of growing importance for society and farmers alike. Therefore, this Flagship Innovation Experiment (FIE) employs a holistic interdisciplinary approach to improve pig health along with reducing antimicrobial resistance (AMR). The skills of all relevant stakeholders in the pig production sector are integrated into the project, giving the farmer the ability to initiate the necessary countermeasures to keep their pigs healthy.
Research results indicate that criteria like humidity, temperature, noise, water and feed consumption are significantly impacting animal welfare. At the moment, however, those parameters are not recorded or taken into account continuously to improve pig health. Consequently, this FIE addresses this strategic challenge to farmers and veterinarians while also addressing the societal concern of antibiotics use and pig health, through a sustainable ecosystem.
To reduce the occurrence of diseases, an AI-based model was developed to predict the pig's health status. To achieve this goal, digitalized sensors were installed, and stable climate and production data, as well as information on the health status of the pigs, was gathered, aggregated and processed. The health status was assessed by veterinarians every second day. Taking into account the number of pigs and clinical assessments as well as the severity of the symptoms (diseases), health indices were calculated. Using static historical data, the model was trained. Afterwards, the model was validated and tested. Via an online REST-API, the solution was implemented.
Implementation
The following sensors were implemented on a farm:
- 12 sensors to measure the water consumption
- 18 sensors to measure temperature
- 5 sensors to measure humidity
- 1 NH3 sensor
- 1 CO2 sensor
SmartPigHealth focuses on identifying the following symptoms: skin lesions, flank biting, lameness, nose discharge, ear injuries, tail injuries, respiratory symptoms, diarrhoea, and abnormal behaviour.
Challenges and Lessons Learnt
The success of the machine learning-based model depends on the quality of the data. The challenge of creating an appropriate model for the prediction of the health status was to match the output of the model (the prediction of specific health indices) with the currently given values.
To merge the data of the clinical assessments (which were taken every second day) with data of the sensors (which were taken every minute), the data was interpolated. The gathered information related to different periods (e.g. days, minutes). The length of time between the first symptoms and the onset of a disease is specific to a disease. Signs of respiratory disease can be noticed hours in advance, whereas tail biting is obviously short-term.
Extensive investigations started on one farm to get a clue on what is 24/7 going on on commercial farms. However, having in mind that the variety of production conditions that are encountered in pig production cannot be represented.
The experiences on one farm showed even big differences in the conditions for the pigs within a barn. Further investigations are required to optimize equipped stables with sensors.
During the tests, some problems occurred. Under real-world conditions where the internet goes down intermittently, an MQTT standard was programmed and has been implemented to save the data in case of a failure even after a power outage or internet outage.
To protect the sensors from environmental influences and the pigs in the barn, self-build casings or protective devices were built, as you can observe in the pictures below.
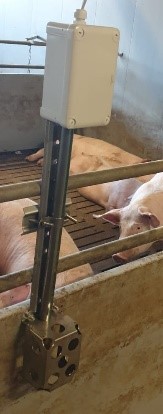 |
 |
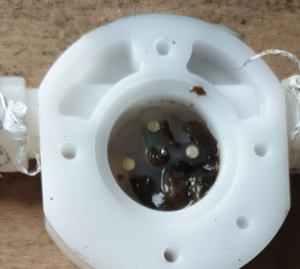 |
To measure the water consumption flow meters were installed for one compartment as well as for each pen. The water consumption of the compartment should be identical to the water consumption of the aggregated pens. Over time we noticed differences. We then identified that the flow meters were clogged. Either we have to get another flow meter or the farmers have to improve the quality of the water system. Water quality impacted heavily on water consumption due to reduced water flow through the nipples.
Success Stories
Water consumption
The vet noticed that the water consumption in the measuring compartment decreased significantly compared to the two previous days. When asked by the vet whether there had been any changes on the farm in the last few days, the farmer replied that he had added acid to the drinking water on the advice of an acid supplier. The addition of acid should not affect water consumption. In response to the information regarding the decrease in water consumption, the farmer eliminated the acid additive. Water consumption increased to the previous level.
By measuring water consumption, it was shown that the use of acid has reduced the water intake of the animals. The manufacturer of the acid mixture advertises an increased water consumption due to the use of the acid.
Through the information provided by the sensors, the farmer was able to refute and to react accordingly to the statements of the acid manufacturer.
Drop of Temperature
In the compartment with reared piglets, the target temperature should be 26°C. Suddenly, the temperature quickly dropped by almost 3°C within a few hours. The vet noticed the sharp drop in temperature and asked the farmer about possible reasons for the sharp drop in temperature.
The farmer had not noticed the drop in temperature yet. After the call, an investigation was carried out. A defective gas heating system was identified as the reason for the drop in temperature. The gas heater was immediately repaired.
The risk of respiratory infections caused by a sharp drop in temperature could thus be prevented.
Increase of CO2
The veterinarian observed a high CO2 concentration in a pig compartment. The farm manager was informed about the high CO2 concentration. An investigation into the causes of the high values was carried out. Due to the low outside temperatures, the farmer had set the ventilation very low. The air exchange decreased. The farmer reset the ventilation. As a reaction to this, the air exchange was increased again and the CO2 concentration dropped.
By continuously measuring the CO2 concentration in the compartment, the increasing concentration of harmful gas was detected. The farmer initiated appropriate countermeasures via the ventilation control.
High levels of CO2 are associated with performance depression, susceptibility to respiratory disease, and ear edge necrosis.

Flagship Innovation Experiment
FIE# 11
Regional Cluster
North-West Europe
Sector
Animal Production
Location
Germany
Partners
lead:
Marketing Service Gerhardy
member:
Chamber of Agriculture Lower Saxony
- swine health service
member:
innosep GmbH
member:
VzF GmbH Erfolg mit Schwein
- Consultant services
member:
Verein zur Förderung der bäuerlichen Veredelungswirtschaft e. V.
- Consultant services
member:
Mitteldeutsche Agentur für Informationsservice GmbH
Contact
Please log in to the Innovation Portal to see the contact details